date: 2025-05-28
title: CSN-Literature-Review
status: DONE
author:
  - AllenYGY
tags:
  - LiteratureReview
  - CSN
  - CCSN
publish: false
Literature Review: Construction of cell-specific networks from scRNA-seq data
Introduction
A. Overview of single-cell RNA sequencing (scRNA-seq)
Single-cell RNA sequencing (scRNA-seq) is a powerful technique that allows researchers to analyze gene expression at the individual cell level. It reveals cellular diversity and identifies rare cell types that would otherwise be hidden in bulk RNA sequencing. The workflow involves isolating single cells, capturing their RNA, and using high-throughput sequencing to profile their transcriptomes. This technology has wide-ranging applications in developmental biology, cancer research, immunology, and more.
B. Challenges in scRNA-seq data analysis
However, scRNA-seq data often suffer from high technical noise and low sequencing coverage compared to bulk RNA-seq, making it challenging to accurately measure gene expression levels. These technical limitations can lead to false negatives and difficulties in detecting low-abundance transcripts. To address these issues, specialized computational methods are required to normalize the data, reduce noise, and extract meaningful biological insights.
C. Objective of the review
This review aims to examine how Cell-Specific Networks (CSN) and Conditional Cell-Specific Networks (c-CSN) help overcome the challenges of high technical noise and low coverage in scRNA-seq data. It highlights how these network-based approaches improve the accuracy of gene expression analysis and enable deeper biological insights.
Traditional Methods for scRNA-seq Data Analysis
A. Gene expression-based methods
Traditional methods for scRNA-seq data analysis often rely on gene expression-based techniques to reduce complexity and visualize high-dimensional data. Principal Component Analysis (PCA) is widely used to identify major sources of variation by projecting data onto principal components. Non-negative Matrix Factorization (NMF) decomposes the data into biologically interpretable features, helping to uncover underlying cellular states. t-distributed Stochastic Neighbor Embedding (t-SNE) is popular for visualizing cell clusters in low-dimensional space, preserving local relationships between cells. However, these methods may struggle with scalability, interpretability, or sensitivity to noise in large and complex scRNA-seq datasets.
B. Clustering methods
Clustering methods play a crucial role in scRNA-seq data analysis by grouping cells with similar gene expression profiles into distinct cell types or states. Hierarchical clustering organizes cells in a tree-like structure, allowing visualization of relationships at multiple resolution levels. K-means clustering partitions cells into a predefined number of groups based on expression similarity, though it may be sensitive to initial parameter settings. More advanced techniques like SNN-Cliq (Shared Nearest Neighbor clustering) leverage graph-based approaches to improve robustness and accuracy in identifying complex cellular subpopulations. These methods collectively enable researchers to uncover the underlying cellular heterogeneity present in single-cell datasets.
C. Limitations of traditional methods
Traditional scRNA-seq analysis methods often fail to capture cell type-specific gene interactions, limiting the understanding of unique regulatory mechanisms within distinct cell populations. These approaches typically focus on individual gene expression levels rather than the complex interactions between genes. As a result, they lack a network-level perspective, which is essential for uncovering how genes work together in specific cellular contexts. This limitation highlights the need for more advanced models that integrate gene regulatory networks with single-cell data.
Introduction to Cell-Specific Networks (CSN)
A. CSN Definition and rationale
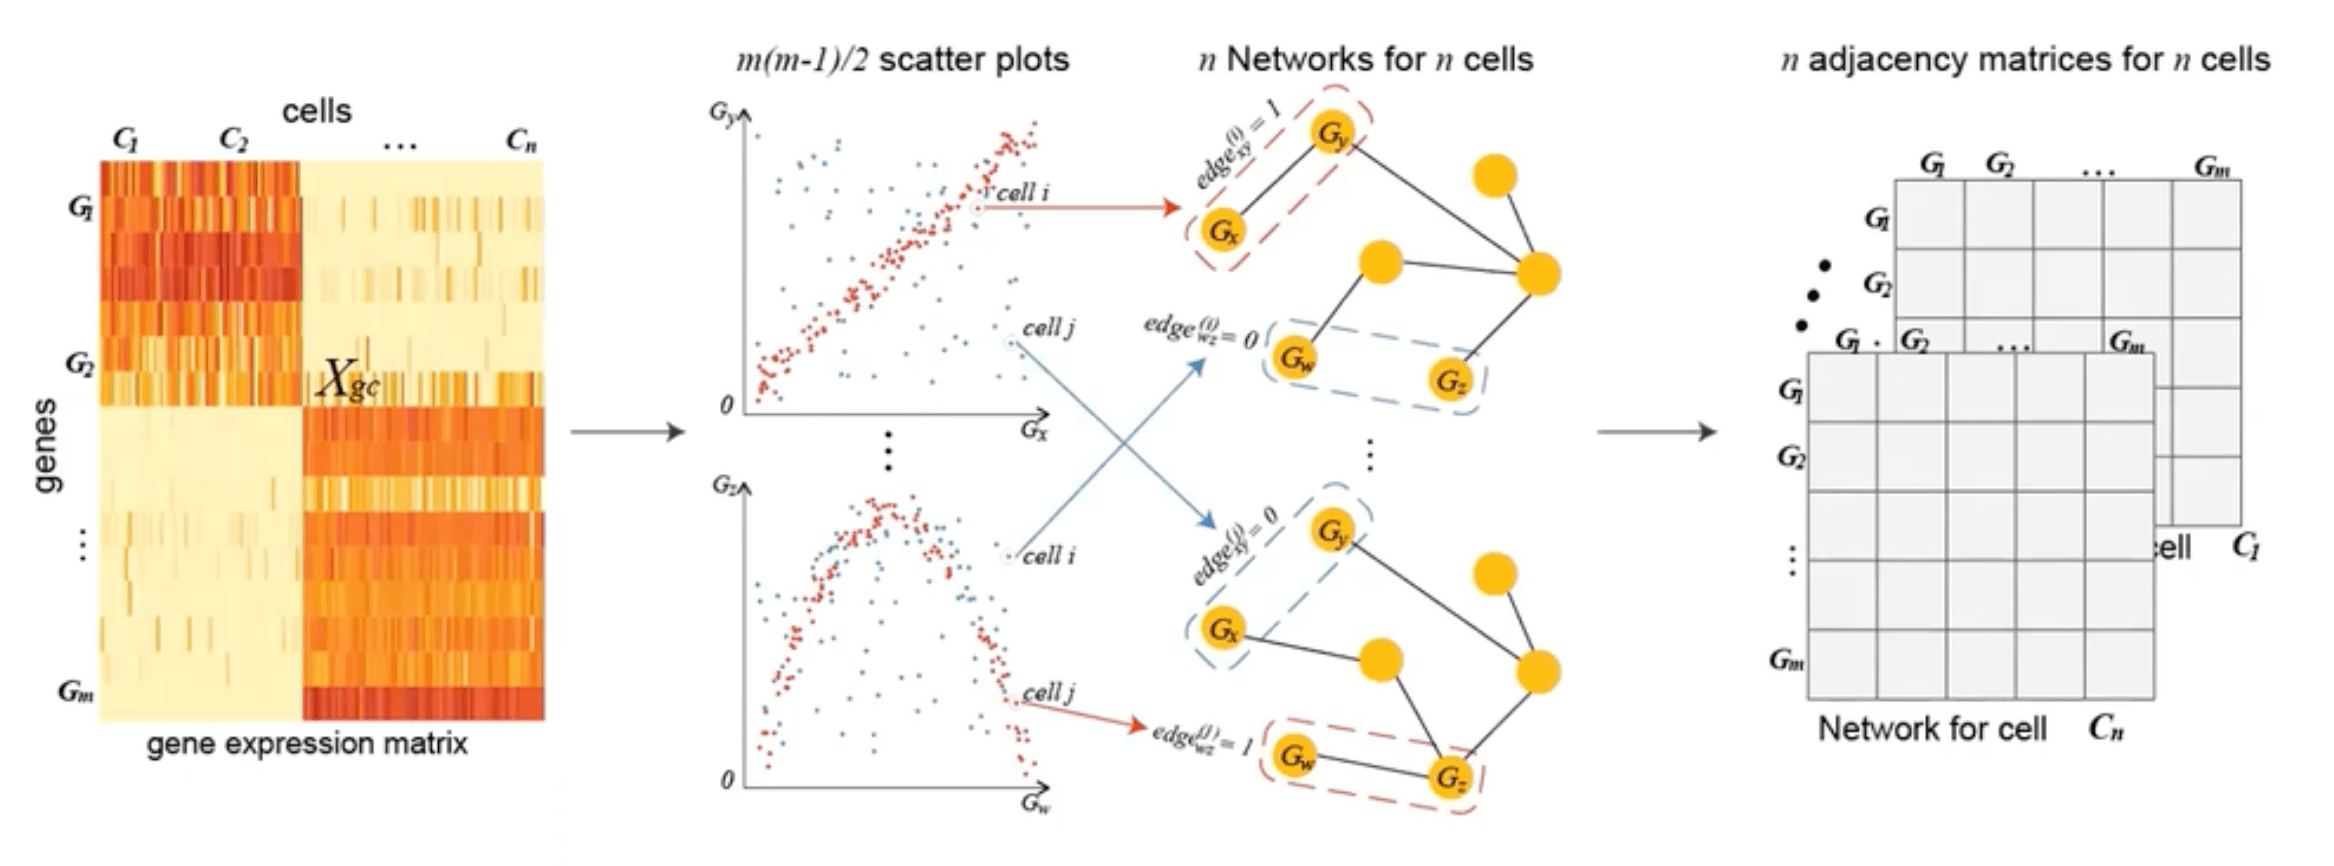
Cell-Specific Networks (CSN) provide a framework for transforming single-cell gene expression data into gene association networks tailored to individual cells, capturing the unique regulatory interactions within each cell. In a CSN, each cell is represented as a network where nodes correspond to genes and edges denote potential functional relationships or interactions between gene pairs, often inferred from expression correlations. Mathematically, given
B. Methodological Approach for Constructing Cell-Specific Networks (CSNs)
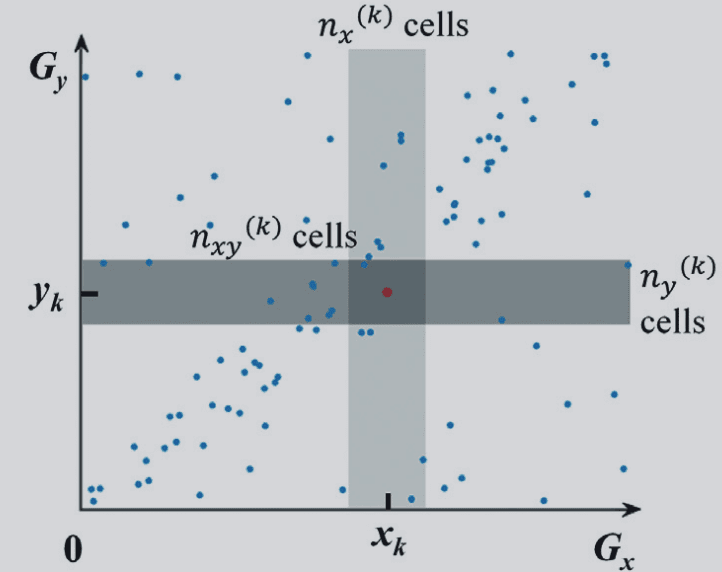
In CSN construction,
The core statistic
Key Formulas for Gene Dependency Inference
-
Test Statistic
- Compares the observed dependency
- Compares the observed dependency
-
Dependency Measure
- Quantifies the deviation from independence by comparing the observed co-expression count (
- Quantifies the deviation from independence by comparing the observed co-expression count (
-
Asymptotic Distribution
- Assumes
- Assumes
-
Variance of Dependency Measure
- Estimates the noise in
- Estimates the noise in
C. Advances and contributions
The CSN framework enables single-cell resolution analysis of gene-gene interactions, transcending bulk data limitations to capture cell-specific regulatory dynamics. By quantifying network connectivity, it identifies key regulatory genes and modular interactions that drive cellular functions, even detecting "dark genes" with significant network roles but minimal expression changes. The Network Degree Matrix (NDM), derived from CSNs, facilitates cell clustering and pseudo-trajectory analysis, offering a robust alternative to traditional gene expression matrices for capturing cellular heterogeneity. This approach reveals dynamic network rewiring during development or disease, enabling the reconstruction of lineage progression and functional states at unprecedented granularity. Collectively, these advances unlock a network-centric view of single-cell biology, enhancing our understanding of cellular diversity and regulatory complexity.
Advancements with Conditional Cell-Specific Networks (c-CSN)
limitations of CSN
The original Cell-Specific Network (CSN) method faces a key limitation: it overestimates gene-gene associations by including both direct and indirect interactions, leading to dense, inaccurate networks that may misrepresent true regulatory relationships.
To address this, conditional Cell-Specific Networks (c-CSN) introduce conditional independence testing, which filters out indirect associations by evaluating gene pairs while conditioning on other genes (e.g., key regulatory hubs). This allows c-CSN to identify direct associations uniquely relevant to each cell, producing sparser, more biologically meaningful networks.
Concept of conditional independence
Conditional independence in c-CSN refers to evaluating whether two genes (
C. Methodological Approach for Constructing Conditional-Cell-Specific Networks (cCSN)
In cCSN (conditional cell-specific network) construction, the framework extends CSN by incorporating conditional independence to filter indirect gene-gene associations. Here,
For each cell
These counts quantify co-expression patterns conditioned on
Key Formulas for Conditional Gene Dependency Inference
-
Conditional Test Statistic
- Purpose: Acts as a z-score to test whether genes
- Interpretation: Values exceeding a critical threshold (e.g.,
- Purpose: Acts as a z-score to test whether genes
-
Conditional Dependency Measure
- Purpose: Quantifies deviation from conditional independence by comparing the observed co-expression of
- Key Insight: A non-zero value indicates a direct association between
- Purpose: Quantifies deviation from conditional independence by comparing the observed co-expression of
-
Asymptotic Conditional Distribution
- Assumption: Under the null hypothesis, the conditional dependency statistic follows a normal distribution, enabling standard hypothesis testing.
- Role: Facilitates statistical inference without parametric assumptions, relying on the central limit theorem for large
-
Variance of Conditional Dependency Measure
- Purpose: Estimates noise in
- Impact of
- Purpose: Estimates noise in
Core Differences from CSN
| Aspect | CSN | cCSN |
|---|---|---|
| Dependency Type | Unconditional (direct + indirect edges) | Conditional (filters indirect edges via |
| Neighborhood Dimensions | 2D ( |
3D ( |
| Key Statistic | $\rho_{xy | |
| Network Sparsity | Denser (includes indirect effects) | Sparser (retains only direct associations) |
By conditioning on third genes (
Limitations and Future Directions
A. Computational challenges
cCSN’s conditional analysis introduces higher computational complexity than CSN, particularly when testing multiple conditional genes or processing large scRNA-seq datasets with thousands of genes and cells.
Developing parallel computing frameworks or optimizing algorithms to scale cCSN for large-scale datasets, reducing runtime while maintaining statistical rigor in conditional dependency inference.
B. Non-causal nature of inferred gene associations
Current c-CSN frameworks infer statistical dependencies rather than causal relationships, limiting their capacity to determine directional interactions (e.g.,
To address this, we propose integrating structure causal models (SCMs) with the cell-specific neighborhood definition from CSN (i.e., the parameter
Conclusion
CSN and c-CSN offer powerful network-based frameworks for analyzing scRNA-seq data, enabling the capture of cell-specific gene interactions and overcoming limitations of traditional expression-based methods by leveraging statistical dependencies and conditional independence to filter indirect associations. These approaches enhance the resolution of cellular heterogeneity, identify dynamic regulatory modules, and support downstream tasks like clustering and trajectory inference, though they face computational challenges and infer statistical rather than causal relationships. Future advancements should prioritize parallel computing optimizations to scale for large datasets while integrating causal inference frameworks, such as adapting the Peter Clark Algorithm with CSN’s neighborhood-based metrics, to deduce directional, cell-specific causal networks. By bridging statistical associations with causal biology, these developments will deepen mechanistic insights into cellular functions, developmental trajectories, and disease states, solidifying network-based methods as indispensable tools in single-cell biology.